Voting Resources
CIS’ “All Job Growth Since 2000 Went to Immigrants” Report Is Flawed
 The Center for Immigration Studies (CIS) has released a number of reports purporting to show that all employment growth since the year 2000 has gone to immigrants. The CIS report does not include econometrics. However, the report includes a few references to the economic literature (those few references present have little to do with native job displacement caused by immigration, which is the topic of the CIS report). Nonetheless, the CIS report has gained significant attention.
The CIS method of measuring job displacement caused by immigration is not used by professional economists to study this issue. Fundamentally, they assume a static number of jobs that is unchanging based on immigration and do not consider what the job market would look like with fewer immigrant workers, entrepreneurs, and consumers – estimates essential for understanding the actual labor market impact of immigrants. I discuss those actual effects here, here, and here.
Regardless of their flawed methods, I decided to recreate CIS’ research in order to exactly understand how they got their results. The CIS study did not find any evidence of immigrants pushing natives out of the job market. After spending hours recreating their data and checking it, all I can conclude is that immigrants hold about a percentage of jobs in the economy that is roughly equal to their percent of the population. I am underwhelmed by that finding.
Below I will present the academic literature on immigration-induced job displacement, explain how CIS got its results, and detail why their analysis of the data does not prove that “All Job Growth Since 2000 Went to Immigrants.” (If you just want the meat, scroll down to “CIS’ Three Big Conclusions are False.”)
Brief Literature Survey
The academic literature finds very little native job displacement caused by immigration.
David Card and John DiNardo looked at native responses to immigration in American cities to test the so-called “skating rink” model of native location decisions, a model that assumes each new immigrant knocks an American out of the workforce. If the skating rink model is correct, natives with skills similar to immigrants should vacate areas where immigrants move to and not move to areas where immigrants are residing. Instead, Card and DiNardo found that an increases of the immigrant population in specific skill groups leads to small increases in the population of native-born individuals in the same skill group. Changes in the local economy, such as the creation of new businesses and types of industries affected by an increase in immigrants, made up for any displacement of native workers.
Another paper by David Card did not find any offsetting native mobility responses to immigrants in the same skill level but did find negative wage effects for some skills sets as a result of immigration. However, Card also found that in the very short-run at least, inflows “of new immigrants in the 1985-90 period reduced the relative employment rates of natives and earlier immigrants in laborer and low-skilled service occupations by up to 1 percentage point, and by up to 3 percentage points in very high-immigrant cities like Los Angeles or Miami” (emphasis added).
Card’s findings in his second paper are consistent with the later findings of economists Gianmarco Ottaviano and Giovanni Peri that newer immigrants compete with the immigrants who preceded them, not with native-born Americans who have similar skills. The labor market effects of new immigrants appear to fall most heavily on immigrants who preceded them, not Americans, which would seem to cut against the theory that immigrants have a large negative effect on American workers.
Even then, David Card and Ethan Lewis in another paper looked specifically at how new Mexican immigrants displaced older Mexican immigrants and found decidedly small effects. Only in Los Angeles and El Paso did new Mexicans push out older Mexicans. In all of the other cities they examined, new Mexican immigrants complemented the existing Mexican immigrant workforce rather than displaced it. To a remarkable degree, the U.S. economy is very good at attracting Mexican immigrants, providing incentives for them to settle in areas where they are most demanded, and responding in ways that increase net production and employment.
A paper by George Borjas seems to find the greatest effect of immigration on the wages of native-born American workers – a wage elasticity of -0.39. Borjas’ finding has been criticized by many, including in this recent paper that extended his period of analysis by 10 years but found only a -.2 wage elasticity as well as other potential problems with Borjas’ methods. Another paper by Giovanni Peri and Chad Sparber also questioned Borjas’ paper, finding that less educated immigrant workers and native born workers specialize in different tasks, thus inducing natives to reallocate their task supply, thereby reducing downward wage pressure. Foreign born workers specialized in occupations that required manual labor and physical skills while natives pursued jobs that required more intensive communication and language skills. Immigration induces natives to specialize accordingly, reducing the negative wage impact of immigration by roughly 75 percent. In other words, natives do not react to immigration by leaving the workforce or moving to different areas, but by changing their skill sets and occupations.
A paper by Christopher L. Smith found that for every 10 percent rise in employed immigrants with at least a high school degree, high school students worked about 3 percent fewer hours and adults decreased their number of hours worked by 1 percent. A Chicago Fed Letter and research paper authored by Daniel Aaronson, Kyung-Hong Park, and Daniel Sullivan discovered that teens are less likely to work for reasons other than immigration. They found that an increase in the relative benefits of education versus work, government financial incentives for schooling, merit based scholarships with minimum grade requirements, and education grants were the primary causes of a decline in teen labor force participation. In other words, teens allocated their scarce time to education and away from work to increase their investment in acquiring human capital and, hence, a higher future income. Low-skilled immigration and stiffer labor market competition was not a compelling explanation for their decline in labor force participation. Another report by the Bureau of Labor Statistics in 2002 echoed the findings of Aaronson, Park, and Sullivan when it concluded:
“In summary, the increasing proportion of teens enrolled in school during the summer and a drop in students’ labor force participation rates contributed to the overall decline in teen summer labor force participation during the recent expansion. Data for October each year indicate that labor force participation among high school students also dropped during the school year, although nonstudents were increasingly likely to participate in the labor force. Together, these facts suggest that, among teens, an increased emphasis was placed on school rather than work during the summer and school year.”
Patricia Cortes does find some displacement effects across cities. These effects are not large enough to equalize wages across the country, and thus not large enough to induce the displacement of one American worker for each immigrant worker. Cortes found that three natives move out of a city for every ten immigrants who move in.
These academic papers do not produce a compelling reason to believe that immigrants displace native-born workers in large numbers. There is likely some job displacement caused by immigration but the effect is small and does not produce a scenario where all job growth goes to immigrants.
Reproducing CIS’ Study
I reproduced CIS’ entire study and data set to properly understand how they reached their conclusions.
Data and Methodology
The data for this investigation was collected through the U.S. Census Bureau’s Consumer Population Survey, and then further transformed using the DataFerrett mining program. Monthly data on employment, citizenship, and population is available through these sources for the period 1994-2014. For some points of analysis, I chose a start year of 1994 as opposed to CIS’ start date of 2000 because their choice of that year and its very low historical unemployment rate added bias to their results.
Findings
Each subsection below details the findings.
Immigrant Share of Employment
There is a proportional relationship between growth in the immigrant share of the total population and the immigrant share of employment. Unsurprisingly, as immigrants grow as a proportion of the population, they occupy more jobs as a percentage of total employment. The immigrant share of employment has increased over the period 1994-2014 but this increase corresponds with an increase in the share of immigrants as a percentage of the population. The proportionality between the two variables was confirmed by a statistical test, which showed a correlation between the immigrant share of employment and the immigrant share of the population of 96.4 percent. Over the entire 20-year period (1994-2014), the immigrant share of employment has grown a paltry 2.53 percent.
Extending this analysis back to 1994 revealed an interesting pattern. Since 2000, immigrant share of employment has been slightly higher by less than a percentage point than the immigrant share of the population would predict. Prior to the year 2000, the immigrant share of the population was higher than their respective share of jobs. In that sense, during the period 1994-2000, the percentage of jobs given to immigrants was lower than the respective percentage of the population. It is only after 2000 that the percentage of immigrants in the population is less than the immigrant share of employment – again by less than a percentage point. This could be another reason why CIS picked the year 2000 as the start date for their study.
The Effect of Immigrant Employment on Native Employment
Immigration restrictionists claim that an increase in employment among immigrants has a detrimental effect on native employment. The CIS study did not produce an economic model, any econometrics, or a single regression to support that claim. Instead, I ran a few regressions to see if there is any relationship between immigrant job gains and native job losses.
There is an 86.75 percent correlation between native employment and immigrant employment. A regression was then performed on the data to discern the relationship between the variation in native employment and non-citizen employment, which resulted in a statistically significant positive relationship between the variables. The variation in native employment represents the change in the number of jobs held by natives, while the variation in immigrant employment represents the change in the number of immigrant jobs. According to the results of the regression, an increase in immigrant employment by one is correlated with an increase in native employment by approximately 1.614. Basically, every additional job performed by an immigrant is associated with more than one additional native working. This relationship indicates that increases in immigrant employment are not damaging to natives but instead could produce a net benefit. Correlation does not prove causation in this situation but the preliminary findings of this regression show that immigrant job gains are not correlated with net-job losses for natives. It is likely that both immigrants and natives get jobs when the job market is growing – hardly a controversial result.
Additionally, a negative linear relationship was found between the native share of employment and the foreign-born share of employment (see Figure 1). The negative slope indicates that an increase in the share of immigrants with jobs correlate with a decrease in the share of natives with jobs. Although this may seem as though immigrant employment growth is injurious to native employment growth, this is not the case when compared with the immigrant share of population (see Figure 2). If immigrants are a larger share of the population, we would expect them to occupy a larger share of jobs. Since there is no fixed number of jobs in the economy, this finding does not suggest that immigrants take jobs from natives.
Figures 1 and 2 are almost identical. Taken together, the figures demonstrate the proportionality between the share of the immigration population and the share of jobs occupied by immigrants. CIS’ main finding appears to be that the immigrant share of all jobs is about the same as their share of the entire U.S. population.
Figure 1: Immigrant and Native Shares of Total Employment 1994-2014
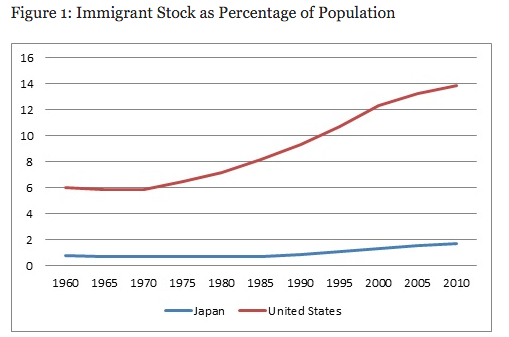
Figure 2: Immigrant and Native Shares of Total Population 1994-2014

Employment and Unemployment Rates by Nativity
Employment and unemployment rates are not significantly different between native and immigrant workers. The unemployment rate for immigrant workers aged 16-65 is higher than that for native workers of the same age (see Figure 3). The employment rate for immigrant workers aged 16-65 is lower than for native workers of the same age (see Figure 4). The findings show that, on average, an immigrant worker is less likely to be employed than a native worker, and this trend has held true for the 16-65 age bracket from 1994 to 2000.
CIS limited its analysis to natives and immigrants in the 16-65 age range. However, when all persons over age 16 are analyzed, the employment rate for immigrants is slightly higher than the employment rate for natives (see Figure 5). Despite the lower employment rate for natives in this case, the percentage difference between the two groups is small; for example, in December 2014, immigrants were only 4.6 percent more likely to be employed than natives.
Looking at the over 65 age bracket for the years 1994-2000, the native employment rate was higher than the immigrant employment rate (see Figure 8). The switchover occurred only in the years immediately after 2000. Moreover, the recent employment rate difference seemingly favorable to immigrants can be explained by the demographic differences between native and immigrant populations. The employment rate for workers over 65 is lower than that of other age groups, and immigrant populations tend to be younger than 65.
Figure 3: Unemployment Rate by Nativity, 16-65
Figure 4: Employment Rate by Nativity, 16-65

Figure 5: Employment Rate by Nativity, All Ages

Figure 6: Unemployment Rate by Nativity All Foreign Born, 16-65
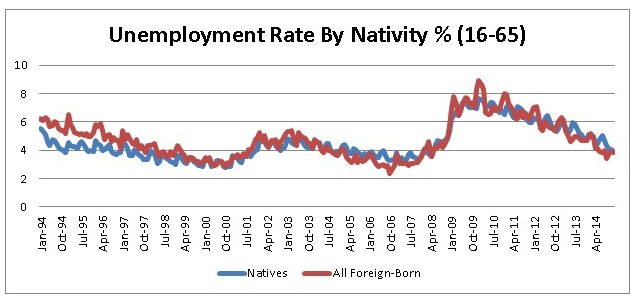
Figure 7: Employment Rate by Nativity All Foreign Born, 16-65

Figure 8: Employment Rate by Nativity All Foreign Born, All Ages
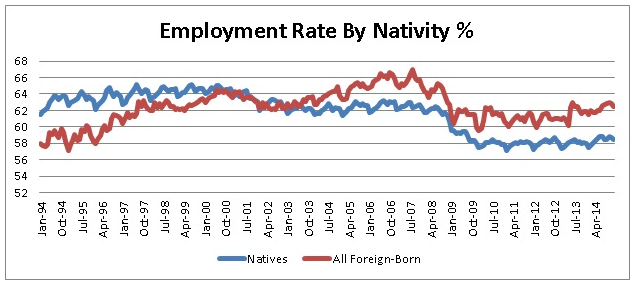
For those in the 16-65 age bracket, an increase in the unemployment rate of all foreign born by 1 corresponds with an increase in the unemployment rate of natives by 0.799. The unemployment rates move in the same direction for both natives and the foreign born (see Figure 6). An increase in the employment rate of all foreign born by 1 corresponds with an increase in the employment rate of natives by 0.345, again meaning that the two rates move in the same direction. An increase in the employment rate for all foreign-born by 1 corresponds with an increase in the employment rate for natives by 0.279, again meaning that they move in the same direction. If immigrants took the jobs of natives, we would not find that their levels of employment or unemployment move in the same direction.
Different Time Periods and Populations
Below I make two major changes to augment the CIS results. First, I compare CIS’ time period of 2000-2014 to the 20 year time period of 1994-2000. The year 2000 is a problematic year to begin this analysis because the unemployment rate was an abnormally low at 4 percent, the lowest over the 1994-2014 period when the CPS data is available and the lowest since 1969 when it stood at 3.5 percent. Picking a year like 2000 with such a low unemployment rate will make subsequent years look bad by comparison. Using 1994 as a start date for this analysis makes more sense because the unemployment rate in that year was 6.1 percent compared to 6.2 percent in 2014. Using start and end years that have similar unemployment rates should allow an analysis to more easily judge the effect of immigration on native employment.
Second, I include all workers who are 16 years old or older. CIS excluded workers over the age of 65 who are now more likely to work than they were in the past. To CIS’ credit, footnote 5 in their paper admits this omission but very few people reporting on these finding bothered to read the fine print – especially when the title of the paper is “All Employment Growth Since 2000 Went to Immigrants” (emphasis added). CIS’ exclusion of the 65 year plus age portion of the American workforce biased their results against natives.
The percentage of total jobs in the economy occupied by natives was 88.48 percent in 2000 and 83.25 percent in 2014. For immigrants in 2000 and 2014 it was 12.17 percent and 16.90 percent, respectively. That is a very small shift in the relative, not absolute, employment of these two big employment groups in the U.S. economy that is roughly parallel to their increase in the population. When compared with each group’s share of the population, native-born Americans and immigrants maintain roughly proportional growth in shares of employment and population throughout the period (see figures 1 and 2).
Furthermore, the relative share of employment for the two groups reveals only a small shift in employment. The native share of employment went from 90.03 percent in January 1994 to 83.25 percent in 2014 (see Figure 1), and the immigrant share of employment grew from 9.97 percent to 16.90 percent during the same time period. Again, the change in the native and immigrant shares of employment corresponds with proportional changes in share of each group’s share of the population.
The number of people older than 16 increased by 53.1 million between January 1994 and December 2014. 63.86 percent of this increase was native-born Americans, while 36.14 percent went to immigrants. Over that period, 53.3 percent of net job growth went to natives while 47.7 percent to immigrants.
CIS’ Three Big Conclusions are False
CIS’ conclusions will be numbered. My responses will follow.
1. The long-term decline in employment for natives is a clear indication that there is no general labor shortage.
There is no evidence for a long-term decline in the number of natives employed. The data indicates that between January 2000 and December 2014, there were two recession years (2009, 2010) that exhibited a significant decline in jobs. However, all other years saw increasing native employment. Between January 2000 and December 2014, 5.19 million additional natives held jobs. There is, however, strong evidence of declining labor force participation. Between January 2000 and December 2014, native labor force participation saw a fairly steady decline from 64.01 percent to 58.46 percent, which was true both for recession and non-recession years. So there isn’t a shortage of jobs, but there is a decreasing percentage of natives who want or are able to work. CIS did not demonstrate that immigrants are the cause of that.
14.4 million more natives held jobs in December 2014 than held jobs in January 1994. From January 1994 to December 2014, native labor force participation steadily declined from 61.54 percent to 58.46 percent.
2. The decline in work among natives over the last 14 years of high immigration is consistent with research showing that immigration reduces employment for natives.
The academic research about immigrant displacement of native born workers is thin and much of it demonstrates the opposite (see “Brief Literature Survey” above). Interestingly, economist Robert Hall found much of the decrease in the U.S. labor force participation rate (LFPR) occurred for members of wealthier households while the LFPR increased for individuals in poorer households since 1999. This directly contradicts CIS’ story that immigrant job competition is the cause of this decline in native employment opportunities and is consistent with the findings of the one of the few academic papers actually cited by CIS. Lower-skilled immigrants can only really compete for jobs with young, uneducated, and low-skilled native-born workers (when there is any competition at all). That younger, uneducated, and low-skilled native-workers in low-skilled households have increased their LFPRs in recent decades is evidence that little competition or job displacement even occurred.
However, Salim Furth of the Heritage Foundation has challenged many of Hall’s findings. Both Furth and Hall have found that teenagers in the lower half of the family income distribution have seen smaller declines in labor force participation compared to teenagers in the upper half of the family income distribution, excluding the effects of the Great Recession. Furth rightly notes that more research is needed on this issue.
The CIS report suggests that 2000 to 2014 was a period of high immigration, although the Census reveals that immigration during that period had slowed down compared to the previous decade. Between 1990 and 2000, the immigrant population grew from 19.8 million to 31.1 million, an 11.3 million person increase that grew the size of the immigrant population by 57 percent. From 2000 to 2010, the immigrant population grew from 31.1 million to about 40 million, an 8.9 million person increase that grew the size of the population by 29 percent – half of the previous decade. The increase in the absolute number and relative percentage of immigrants in the first 10 years of the millennium was smaller than in the last decade of the 20th century.
From the beginning of the Great Recession in 2007 to 2010, the immigrant population increased by 3.2 million. From 2010 to 2013 the immigrant population increased by only 1.3 million – far below the average for any three-year period in recent decades. The growth in the immigrant population is slowing dramatically but the job market is still poor. Unsurprisingly, immigration is not an entirely exogenous shock; rather, it ebbs and flows based on American demand for immigrant workers.
3. Trends since 2000 challenge the argument that immigration on balance increases job opportunities for natives. Over 17 million immigrants have arrived in the last 14 years, and native employment has declined.
CIS didn’t run a regression for the period 2000-2014, but if they did they would have found that an increase in noncitizen employment by 1 is correlated with an increase in native employment by 0.696. That is not the result that we would expect if CIS’ conclusion was correct. CIS did not identify an actual correlation between native job losses and immigrant employment gains. There is nothing in CIS’ backgrounder that demonstrates that immigration causes native unemployment.
Conclusion
Immigrants’ share of jobs is very similar to their share of the U.S. population. That is not a surprising finding and it certainly doesn’t show that they are “taking all the jobs.” On a bigger level, labor markets in every country are changing. Labor’s share of GDP is declining even in countries that accept very few immigrants like Japan. This trend will not change by radically decreasing the number or share of immigrants.