Voting Resources
Extensive Polling Data Released On 2014 Texas Governor’s Race & Other Statewide Elections
 Austin, Texas — The 25th annual Texas Interested Citizens survey (organized by The Eppstein Group) conducted 1,200 live telephone interviews of general election voters who participated in either the 2010 or 2012 general elections. The survey has a +2.9% margin of error at a 95% level of confidence.
Interviewing was conducted August 15-21 and paid for by private corporate sponsors. 35% of the survey respondents had voted in past Republican primaries, 28% in past Democratic primaries, 11% in both primaries, and 27% were pure general election only voters.
In 1990, the Texas Interested Citizens survey project was the first to show Ann Richards defeating Clayton Williams for Texas Governor; and the polling project has correctly surveyed all Texas gubernatorial elections over the past two decades.
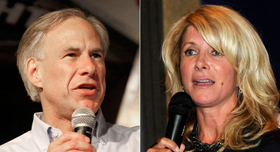
Based on current ballot preference, each candidate’s name ID, and independent voter opinions, the 2014 Texas Interested Citizens survey projects a final November outcome in the governor’s race of 57.8% Greg Abbott vs. 39.3% Wendy Davis.
Most noticeable in the survey is the negative opinion most Texas voters have of State Senator Davis. Among all Texas voters her name identification is 29% Positive vs. 50% Negative; among all female voters, she is 30% Positive vs. 45% Negative; among all male voters, she is 28% Positive vs. 59% Negative; and among undecided voters in the governor’s race, she is 10% Positive vs. 41% Negative.
Below are the survey findings for several of the 2014 Texas general statewide elections.
Texas Governor’s Race
48% Greg Abbott
33% Wendy Davis
2% Kathie Glass (Libertarian)
1% Brandon Palmer (Green Party)
16% Undecided
Female Voters: 44% Abbott vs 36% Davis vs 2% Glass vs 0% Palmer vs 14% Undecided
Male Voters: 53% Abbott vs 29% Davis vs 3% Glass vs 2% Palmer vs 16% Undecided
Anglo Voters: 58% Abbott vs 25% Davis vs 2% Glass vs 1% Palmer vs 14% Undecided
Black Voters: 6% Abbott vs 71% Davis vs 2% Glass vs 3% Palmer vs 18% Undecided
Hispanic Voters: 30% Abbott vs 44% Davis vs 5% Glass vs 0% Palmer vs 21% Undecided
Metroplex East: 47% Abbott vs 39% Davis vs 1% Glass vs 1% Palmer vs 13% Undecided
Metroplex West: 46% Abbott vs 36% Davis vs 3% Glass vs 1% Palmer vs 14% Undecided
East Texas: 56% Abbott vs 25% Davis vs 0% Glass vs 1% Palmer vs 18% Undecided
Greater Houston*: 42% Abbott vs 39% Davis vs 2% Glass vs 2% Palmer vs 16% Undecided
Gulf Coast: 50% Abbott vs 26% Davis vs 1% Glass vs 0% Palmer vs 23% Undecided
Greater San Antonio Area: 51% Abbott vs 34% Davis vs 1% Glass vs 0% Palmer vs 14% Undecided
Greater Austin Area: 40% Abbott vs 36% Davis vs 6% Glass vs 0% Palmer vs 18% Undecided
Central Texas: 59% Abbott vs 26% Davis vs 2% Glass vs 0% Palmer vs 14% Undecided
The Border: 45% Abbott vs 24% Davis vs 4% Glass vs 1% Palmer vs 25% Undecided
West Texas: 66% Abbott vs 18% Davis vs 0% Glass vs 0% Palmer vs 16% Undecided
Panhandle: 67% Abbott vs 17% Davis vs 0% Glass vs 2% Palmer vs 14% Undecided
* 2010 Harris County General Election: 48.15% Perry-R vs 50.23% White-D
2012 Harris County General Election: 49.43% Romney-R vs 49.77% Obama-D
Texas Lt. Governor’s Race
46% Dan Patrick
26% Leticia Van de Putte
3% Robert Butler (Libertarian)
2% Chandrakantha Courtney (Green Party)
23% Undecided
Texas Attorney General’s Race
45% Ken Paxton
26% Sam Houston
3% Jamie Balagia (Libertarian)
2% James Osborne (Green Party)
25% Undecided
Texas Comptroller’s Race
39% Glenn Hegar
24% Mike Collier
4% Ben Sanders (Libertarian)
1% Deb Shafto (Green Party)
32% Undecided
State Constitutional Amendment Prop #1 (State Highway/FM Road Funding)
64% For
25% Against
11% Undecided
Hypothetical 2016 Presidential Ballot: Hillary Clinton vs Ted Cruz
52% Ted Cruz
40% Hillary Clinton
9% Undecided

Comments
Join the discussion on Facebook
Join the discussion on Facebook.