Voting Resources
How many Non-Citizens Vote?
 How many illegal aliens vote is a question that has yet to be answered, but Trump’s Presidential Advisory Commission on Election Integrity headed by Kansas Secretary of State Kris Kobach is attempting to find an answer.
There is certainly enough evidence to show that a significant number of non-citizens have voted across the United States. Jess Richman and David Earnest of Old Dominion University reviewed incidents of voting by non-citizens, and while some have argued that illegal voting is inconsequential, Richman and Earnest attempted to find exactly how many non-citizens vote. They concluded that, “[M]ost non-citizens do not register, let alone vote. But enough do that their participation can change the outcome of close races.”
Using data from the Cooperative Congressional Election Study, they attempted to find out how many non-citizens voted. They found that 14% of non-citizens in both the 2008 and 2010 samples were registered to vote. From that they estimated that 6.5% of non-citizens voted in 2008 and 2.2% voted in 2010.
Their estimation was based on CCES samples that Obama won 80% of non-citizens’ votes and while this did not affect the general election, they speculated that it could have accounted for some Democratic victories in Senate races. Those races include Al Franken’s victory over Norm Coleman in 2008. Franken’s margin was 312 votes and as they concluded, “[V]otes cast by just .65 percent of Minnesota non-citizens could account for this margin. It is also possible that non-citizen votes were responsible for Obama’s 14,177 votes, so a turnout by 5.1% of North Carolina adult non-citizens would have provided the margin for Obama’s victory in North Carolina.” Richman believes that it was entirely possible that the Electoral College votes of North Carolina could have been switched by illegal voters. While the fate of North Carolina didn’t matter on the overall election results in 2008, in a closer election it could matter. Richman and Earnest noted that three quarters of non-citizen had photo ID’s when asked to provide them, making it easier for them to vote.
Virginia Republican activist William Campenni, writing in Power Line, observed, “For years here in Virginia I have observed massive fraud – in the registration process, in the absentee ballot casting, in the battle to remove photo IDs, in the voting at the polls. Recent studies have shown thousands of illegal alien registrations in Virginia, and hundreds of voters also casting votes in other states (college kids the worst offenders). My own identity (SS No.) was stolen last year and used to get a fraudulent tax refund and voting… For over a decade the SEIU and its local affiliates have gone through the extensive illegal alien community here in Virginia fraudulently registering illegals who then vote in large numbers, usually in early voting or absentee ballots, because there are no poll watchers to challenge them. They even brag about it.”
Campenni added that the incumbent Republican, George Allen, may have lost to Jim Webb in 2006 because of illegal voters and Governor Terry McAuliffe may have won his seats owing to their participation. He concluded, “(Mark) Warner defeated Ed Gillespie for Senate in 2014 by the small vote differences provided by illegals. And my friend the local former Fairfax County Democrat head brags about it when we have coffee together.”
J. Christian Adams, an election lawyer who served in the Voting Rights Section at the U.S. Department of Justice under President George W. Bush mentioned the result of a study conducted by The Public Interest Legal Foundation that looked into a small number of Virginia Counties and found that 1000 were removed from the rolls due to citizenship problems. At least 200 of these individuals voted. Adams quoted Democratic operative John Podesta in emails disclosed by WikiLeaks: “Podesta seems to have figured out that, because of vulnerabilities in our election system, foreigners can get registered to vote and get voter ID at the same time. Podesta's right, and has revealed one the biggest vulnerabilities in American elections, all because of the Motor Voter law.” Only four states attempted to determine the citizenship of people obtaining driver’s licenses. Three of them are entangled in ligation.
The Public Interest Legal Foundation followed up on this study and found even more discrepancies as they reviewed 133 Virginia jurisdictions. They found that between 2011 and May of 2017, Virginia removed 5500 illegal voters and found that over 1800 of these individuals had cast nearly 7500 ballots. As Richman and Earnest noted, 80% of non-citizens voted for Obama in 2008 and a Pew Research Center survey estimated that those non-citizens who identify with a political party, do so at a three to one ratio in favor of Democrats.
The Government Accountability Institute studied duplicate voters from registration and found significant fraud. As Hans von Spakovsky noted, “The Government Accountability Institute was able to obtain voter registration and voter history data from only 21 states because while some states shared it freely, ‘others impose exorbitant costs or refuse to comply with voter information requests’. . .The institute compared the lists using an “extremely conservative matching approach that sought only to identify two votes cast in the same legal name.” It found that 8,471 votes in 2016 were “highly likely” duplicates…Extrapolating this to all 50 states would likely produce, with “high-confidence,” around 45,000 duplicate votes.” These data may be the tip of the voter fraud iceberg
Our Surveys
Americas Majority Foundation as part of a post-election survey asked voters if they were US citizens or not. The results of the study showed that a small but significant percentage of the voters self-reported that they were not U.S. citizens. (Our methodology was a simple self-reporting system in which voters were asked if they were U.S. citizens and some voters did admit they were not U.S. citizens.)
We conducted two national polls with two different pollsters. The Voice Broadcasting poll showed that 2.1% of the population who voted were not U.S. citizens. The second national poll had the numbers at .9%. While this may not sound like a lot we are talking anywhere from 1,200,000 to 3,500,000 voters nationwide.
This alone could have added anywhere from 900,000 of the popular vote to slightly over 2,625,000 votes for Hillary Clinton. (This was based on Democrat candidates receiving 75%, of the non-citizen vote, probably a conservative estimate. If Richman and Earnest are right about the number of illegals voting 80% or higher for Democrats, that would suggest that our estimates are probably low.)
This question was asked of 34,000 plus voters in seven states: Nevada, Colorado, Wisconsin, Michigan, Pennsylvania, Ohio and North Carolina. The breakdown was as following of non-citizen voting: 2.3% in Nevada, 1.8% in Colorado, 3.8% in Wisconsin, 2.5% in Michigan, 2.1% in Ohio, 2.4% in Pennsylvania.

While this did not affect the outcome of the presidential or senatorial races in those states, there is no doubt that illegal alien votes decreased the percentage of voters who were Republican and increased those of Democrats. We estimate that Democrats received a boost of at least 19,000 votes in Nevada, 21,500 in Colorado, close to 56,000 in Wisconsin, slightly over 76,000 votes in North Carolina, 69,000 in Pennsylvania, 56,000 in Ohio, and nearly 86,000 in Michigan. This represents nearly 384,000 votes in the Democratic tallies in just those seven states. (This is based on Democrats receiving three quarters of non-citizens voting. Richman and Earnest would argue that I might be on the low side.)
While the presidential level and Senate races were not affected; the 2016 North Carolina race between Roy Cooper, the Attorney General (who made opposing voter ID or any steps to reduce non-citizens from voting a central plank) and the incumbent governor Pat McCrory most likely was affected. Cooper beat McCrory by the slimmest margin of only 12,000 votes.
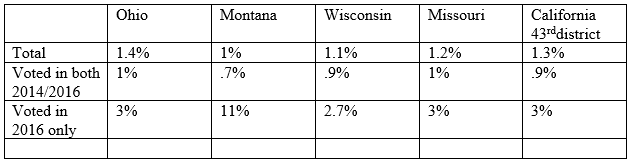
From April 2017 to July 2017, we continued to review the number of illegals in separate polls in four battleground states and one congressional district in the California 43rddistrict. Just as we did in our polls after the election, we asked voters if they were United States citizens or not. In this survey, we asked voters if they voted in the past two elections, 2014 and 2016, or if they only voted in the 2016 election. We then checked to see how our numbers compared to our post-election poll and compared voters who voted over multiple elections with those who just voted in the last Presidential election.
In every state we surveyed, along with the California 43rd district, we discovered that at least 1% of voters responded that they were not citizens. 1.1% of Wisconsin voters, 1.2% of Missouri voters, 1% of Montana voters, 1.4% Ohio and 1.3% of California 43rd District voters stated they were non-citizens. However, when we looked inside the numbers, we found an anomaly. 1% of Ohio voters who voted in both elections reported being non-citizens and yet 4.5% voters who stated that they just voted in 2016 reported being non-citizens. .9% of California 43rd voters who voted in both elections stated they were non-citizens compared to 3% of voters who only voted in 2016. .7% of Montana voters who voted in both elections claimed to be non-citizens compared to 11% who only voted in 2016. 1% of Missouri voters who participated in multiple elections claimed to be non-citizens compared to 3% who voted in 2016. And .9% of Wisconsin voters who voted in both 2014 and 2016 elections admitted being non-citizens as opposed to 2.73% voters who only voted in 2016.
Our overall numbers were comparable to another national pollster, Cyngal, who found .9% of those they polled to be non-citizens, but that poll was roughly one half of what we discovered in our other national poll and the separate battleground states conducted by Voice Broadcasting.
We polled two states in 2017 that we polled after the election in 2016 for comparison. In Ohio, for instance, we found in November 2016 that 2.1% of citizens classified themselves as non-citizens while in our poll may of 2017 1.4% of Ohio voters totaled stated they were non-citizens. However, of those who reported they voted in 2016, 3% declared themselves non-citizens. In our 2016 Wisconsin survey, 3.9% of voters reported they were non-citizens but 1.1% of those polled in Wisconsin in our April 2017 survey reported voting stated that they were non-citizens. When we once again compared the numbers of the 2017 Wisconsin poll of those non-citizens who reported they voted only in 2016, the number rose to 2.7%. So those who voted in 2016 only were close to the numbers we found in our previous survey eight months earlier.
One factor that can’t be dismissed is that voters are more likely to vote in general elections as oppose to the midterm and it may be simply easier to mobilize illegal voters for a general election. Richman’s data on illegal voters matched ours as he noted that in 2008, 6.5% of illegal voters voted in the 2008 general election compared to only 2.2% in the 2010 midterms. Our own research supports his results, both in numbers of illegal voters and the fact that illegal voters are three times more likely to vote in general elections than in midterms.
We found that we reviewed voters who voted in multiple elections, the overall numbers were less than we reported in our post-election states but when we compared to those who voted in 2014 and 2016 versus 2016, we found that those who voted in 2016 only were three times more likely to have been non-citizens than those were voted in multiple elections.
Our data, backing up what Richman and Earnest reported in their paper, shows that non-citizens do vote, possibly in significant numbers that can be measured in the millions nationwide. We estimate that 2.5% of voters in our 2016 survey covering seven key battleground states were non-citizens and that at least one crucial election in 2016, the governor’s race in North Carolina, could have been affected. Just as Al Franken owes his seat to illegal voters, could Roy Cooper owe his victory to illegal voters?
James O’ Keefe caught long-time Democratic Political operative Scott Foval on tape, bragging that Democrats have been committing voter fraud for decades and added, “Let’s just say, in theory, if a major investigation came up of major vote fraud that way, how would they prove it? And who would they charge? Are they going to charge each individual with voter fraud? Or are they going to go after the facilitator for conspiracy, which they could prove? It's one thing if all these people drive up in their personal cars. If there's a bus involved, that changes the dynamic... You can prove conspiracy if there's a bus, but if there are cars, it is much harder to prove." Our own finding is that the numbers for illegal voters who voted just in 2016 were much higher than the numbers of illegal voters voting in multiple elections. That could be the results of intense efforts on part of political parties to register illegal voters in the past election.
We may be looking at 1.2 million to 3.5 million non-citizens voting illegally and while our numbers don’t support the idea that Trump would have won the popular numbers in 2016, he would have been closer with the final tab. Hillary margins would have been 1 million to 2.2 million voters smaller than the final results. What if the votes were closer, similar to margins we saw in the 2000 elections or the 1960 elections? Considering how close state like Pennsylvania, Wisconsin and Michigan this past election, is there a possibility a closer election that illegal voters could throw the elections? These are questions worth examining further.