Voting Resources
The Fiscal Impact of Immigration in the United States
Government spending in the United States is enormous. Federal and state governments spent over $9 trillion in 2022 on the welfare state, defense, health care, education, and other areas. Taxes and borrowing fund that spending, the latter being a delayed tax increase or spending reduction. Such a large government raises a vital question regarding immigration: Do immigrants consume more in government services than they pay in taxes? In other words, do immigrants impose a burden on taxpayers? In our recent paper, “The Fiscal Impact of Immigration in the United States,” we investigate this question and find that immigrants pay more in taxes than they consume in benefits, on average.
Many researchers have grappled with this question. Many years ago, I spent an entire summer reading every academic paper and report on the topic I could find. Later, the National Academy of Science (NAS) published a report in 2017 that included a robust fiscal model. Unfortunately, because of the time it takes to produce such a report and delayed government data releases, most of the NAS analyzed years up to 2013 and then projected forward.
Although the NAS report analyzed data from almost a decade ago, it is still widely cited because the issue is so important. Therefore, my colleagues and I decided to update it. We acquired the NAS model from the scholars who produced it and replicated their results. We then produced two different models included in the paper – an Updated Model and a Cato Model. Both models analyze the historical, current, and projected impact of immigration on the public fisc. We then present the projected fiscal impacts in net present value terms (NPV).
The Updated Model updated the NAS results for the year 2018. The only significant methodological change we made is that we could only consider government spending and taxes over the next 30 years, while the NAS report considered the next 75 years. We had to make this change because the NAS model relies on Congressional Budget Office (CBO) projections for future government spending and tax revenue, and they only publish 30‐year projections now. The results of the Updated Model are similar to those of the NAS. The Cato Model makes other methodological changes based on more recent research by other scholars and our own judgments. This post will explain the Cato Model, the methods we used to construct it, and the results.
Methodology
The Cato Model begins on page 132 of the paper. We make several methodological changes from the NAS based on new findings and our own judgment to better measure and model the fiscal impact of immigration (Box 6 contains our changes). Although we made several changes, three are very important to notice. The first is classifying the young U.S.-born children of immigrants as native‐born Americans in the second generation rather than in the first generation (immigrants). This choice is controversial as some argue that U.S.-born dependent children should be counted in the immigrant generation because they wouldn’t be here without the immigrants. That’s a fair point until you realize the same argument applies to every generation. It’s more accurate and easier to classify immigrants as immigrants and native‐born Americans as natives, so we did that.
The second significant change we made is how we predict the final education levels of young individuals. Few individuals have completed their educations by age 15, for instance. The ultimate level of education is important to estimating the fiscal impact because more educated people, on average, earn higher wages, pay more in taxes, and consume fewer benefits. The NAS assigned immigrants their parent’s education level until age 25, after which it predicted their ultimate level of education through regressions based on their country of origin and other factors. The Cato Model took it one step further and assigned ultimate education levels to immigrants under 25 with that predictive regression.
The third major change we made was to incorporate an important insight based on research by economist Michael Clemens. He argued that the NAS report undercounted the taxes paid because of immigrants working in the United States by overlooking basic microeconomics:
Intuitively, after a firm has set its demand for labor and capital to maximize profits, suppose it raises its labor demand by one to hire an immigrant. Without general‐equilibrium shifts in prices or productivity, this increase in labor demand would by definition reduce profits if it occurred without also hiring capital—such as buying an additional computer or renting additional retail space for the worker to use. That additional capital must generate additional capital income, in an amount bounded from below by the reservation price of capital, for a profit‐maximizing firm. This yields bounds on the consequent capital tax revenue caused by the worker’s employment. The alternative, implicit assumption maintained by direct fiscal accounting methods is that firms pay wages to the marginal employed immigrant to reduce profits—sacrificing capital income they could have received with a different investment, and thus avoiding the consequent capital taxes.
The Cato Model thus captures some of the total tax effects of immigration that other models have difficulty apportioning. This methodological change is just the first step in accounting for the total fiscal costs and benefits of immigration that we will expand in future iterations of the Cato Model.

Results
It’s best to start with the current results of the Cato Model for the year 2018 compared to earlier years analyzed using the same methods. Table 25 reports subpopulation size for each generation, per capita receipts and outlays, and net fiscal impacts for each generation at different levels of government in 1994, 2013, and 2018. If the ratio of receipts to outlays is greater than 1, that subpopulation pays more taxes than it receives in benefits.
The receipts‐to‐outlay ratio for the first generation is greater than 1 for every level of government and in total, meaning that the first generation pays more taxes than it consumes in benefits. To put their impact in perspective, in 2018, the average per capita fiscal contribution of first‐generation immigrants was $16,207. In contrast, the average drain was $11,361, resulting in a net positive fiscal impact of $4,846 per immigrant in 2012 dollars. Multiplied by the number of immigrants present in 2018 (45.4 million), this amount results in a cumulative net fiscal impact of +$220 billion. Adjusted for inflation, that number is 1.2 percent of U.S. GDP in 2018 ($18.7 trillion in 2012 dollars) and 3.7 percent of all 2018 government spending ($6.031 trillion in 2012 dollars). The former number is roughly in line with the Organisation for Economic Co‐operation and Development’s 2006–2018 estimates, which are 1 percent for the United States and between plus or minus 1 percent for most OECD countries
The fiscal impact in 2018 and earlier years is a good starting point. However, the temporal nature of tax receipts and outlays can change the picture dramatically. For example, the young and the elderly consume more government benefits in the form of education and welfare when young and entitlements and health care when older. They also pay less in taxes when younger and older. The Cato Model finds that immigrant individuals who arrive at age 25 and who are high school dropouts have a net fiscal impact of +$216,000 in net present value terms over the next 30 years, which does not include their descendants. Including the fiscal impact of those immigrants’ descendants reduces those immigrants’ net fiscal impact to +$57,000. By comparison, native‐born American high school dropouts of the same age have a net fiscal impact of −$32,000 that drops to −$177,000 when their descendants are included (Table 31).
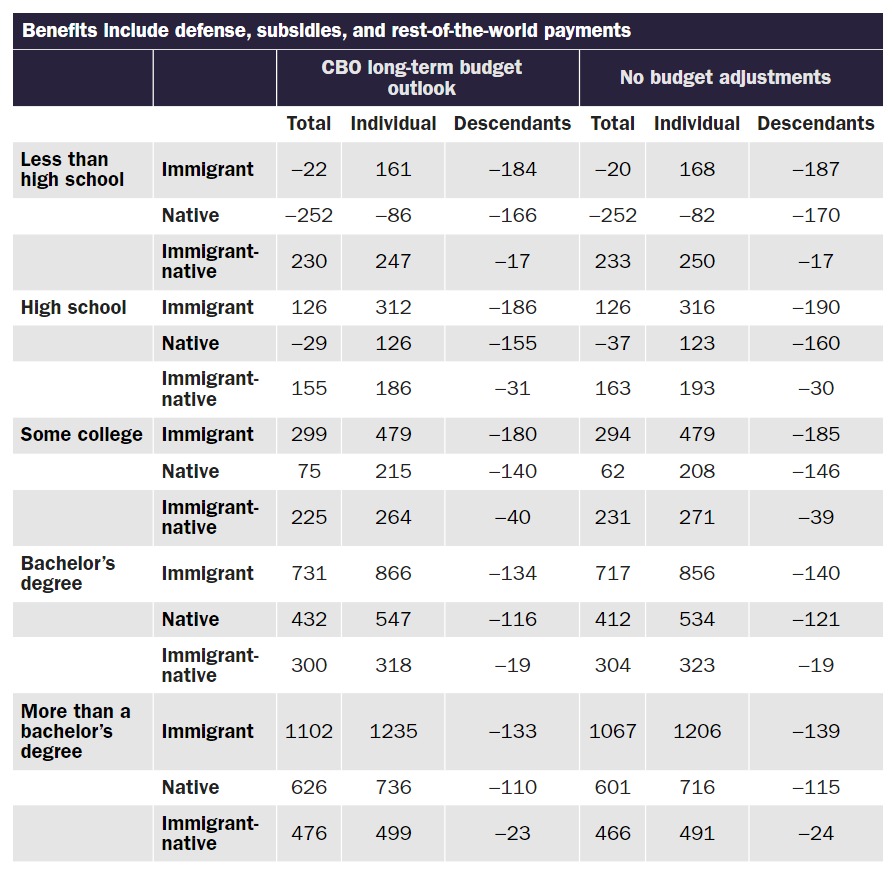

On the opposite side of the educational spectrum, the positive fiscal impact of immigrants with more than a bachelor’s degree is $1.254 million in NPV terms and $1.114 when including their descendants. To show how much the age of arrival matters for the net‐fiscal impact, a high‐school dropout immigrant who arrived at age 50 imposed a −$37,000 cost, but his descendants only cost −$1,000 due to the limits of the 30‐year projection and because not many people have children at age 50 or later. An immigrant with more than a bachelor’s degree has a positive impact of +$589,000 – less than half if he’d arrived at age 25. An immigrant’s age of arrival and level of education matter the most for predicting their net‐fiscal impact.
Another important factor to consider is how to apportion the cost of public goods. In economics, public goods are non‐excludable and non‐rivalrous, which means that people can’t be excluded from benefiting from the goods and one person’s consumption doesn’t reduce another person’s consumption. Education is not a public good under this definition because students can be excluded from school and they consume educational resources that other students could consume. The classic public goods example is national defense. A person benefits from national defense as they’re covered by air defense systems and the nuclear deterrent by being present in the United States, for example. Beneficiaries can’t be excluded if they don’t pay – think of how impractical it would be to defend your house against and enemy army but not your neighbor’s house. Your consumption also doesn’t diminish the national defense of others. We can all think of cases where the public goods argument for national defense doesn’t hold, but it’s the best case of a human‐supplied public good.
For a fiscal analysis, researchers need to figure out how to apportion the costs of public goods. For example, are the costs apportioned equally among immigrants and natives? Do immigrants pay the marginal cost? Or do they pay nothing because the cost of public goods would have been incurred regardless? We present these findings in our paper, but we focus on the results that do not apportion the costs of public goods provision to immigrants in the form of consumption of government benefits because it’s unlikely that more immigrants mean the U.S. government would boost national defense spending. Does a larger immigrant population require more nuclear weapons? Probably not. Figure 28 shows our results for all immigrants, recent immigrants, and native‐born Americans. Interestingly, recent immigrants have a more positive fiscal impact.

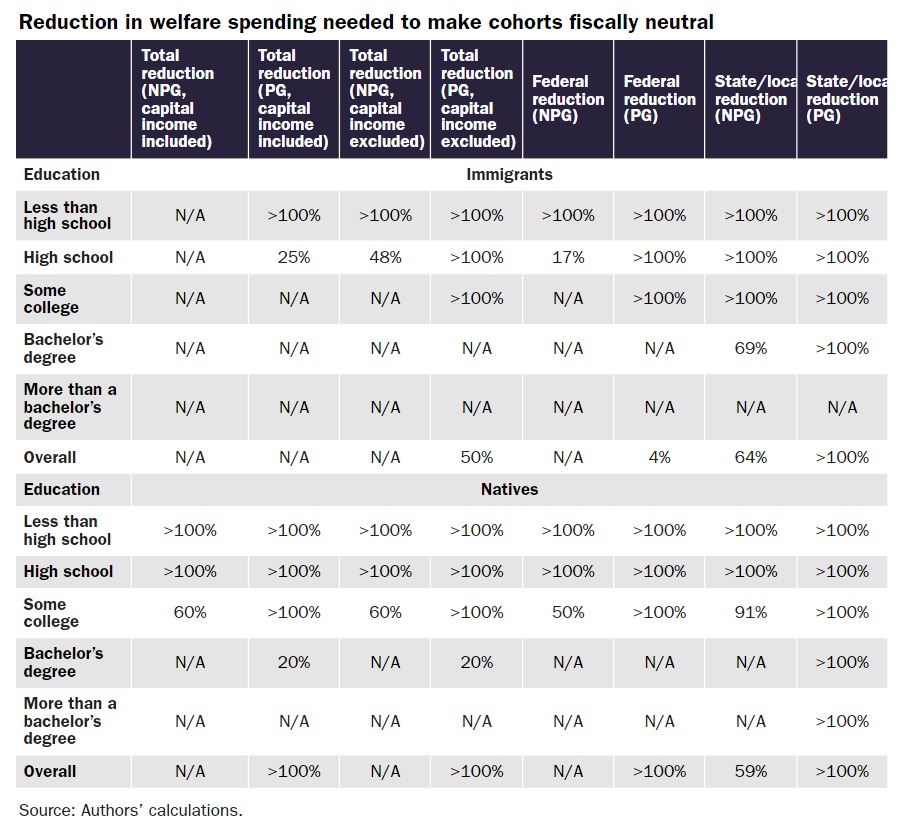
For policymakers, we added a table that shows how much of a reduction in welfare spending (Box 5 in the paper defines welfare) would be required to make immigrants fiscally neutral, grouped by education at the state/local, federal, and total levels (Table 34). Fiscally positive cohorts are recorded as “N/A.” For others, even reducing their welfare receipts to zero would not be enough, so the box says “>100%.” The columns in Table 34 examine different levels of government and whether or how public goods and taxes on capital are included. Thus, policymakers can improve the fiscal impact of immigration by reducing welfare spending on immigrants and estimate the effects under different cost‐accounting scenarios.

Conclusion
The United States faces a considerable fiscal challenge with the explosive growth in government spending, the escalation of entitlement payments, and slower demographic growth. How immigrants impact the fiscal state of the U.S. government is important for policymakers and the public to consider when evaluating different reforms to get the U.S. government onto a sounder fiscal footing. Our paper “The Fiscal Impact of Immigration in the United States” is the first in a new series of Cato papers that analyze the fiscal impact of immigration. It’s 248 pages of information, data, explanations, figures, and charts that show immigrants pay more in taxes than they receive in benefits, on average. In the coming years, we will update the Cato Model with new data and CBO projections. Immigrants pay more taxes than they consume in benefits on average, but the results differ based on their age of arrival in the United States and their ultimate level of education.