Voting Resources
The US Labor Market Explains Most of the Increase in Illegal Immigration
The flow of illegal immigrants across the southern border has markedly increased over the last several years. In FY2021, Border Patrol had 1,659,206 encounters with illegal immigrants and other border crossers along the southwest land border, which grew to 2,206,436 in FY2022, and 2,045,838 in FY2023. From a low of less than 20,000 in April 2020, due in large part to the pandemic-induced collapse in employment, encounters have risen steadily and began to rise even faster after President Biden took office.
Many are blaming President Biden’s immigration policies for the rapid increase in border crosser. My colleague David Bier runs through many of Biden’s policy changes in immigration over the last several years in The New York Times. As Bier mentions in that piece and I wrote over a year ago, most of the increase in illegal immigration can be blamed on the strength of the labor market rather than the administration’s tinkering with border enforcement policies.
There were more than 9.5 million non-farm job openings in September 2023, below the average of about 10.4 million per month during the Biden administration. The number of non-farm job openings in September 2023 is higher than at any point during the Trump, Obama, or Bush administrations. The wage gain for immigrants in the United States is already between about a 4-fold and a 10-fold increase compared to labor in mostly Latin American and Caribbean countries, even accounting for the higher cost of living in the United States. Since legal migration is very restricted, many come illegally to work. There simply are not enough temporary work visas available in enough sectors of the U.S. economy for legal migrant workers to meet the demand, so illegal migrant workers meet it. That already high wage premium and extraordinary labor demand likely explain why the number of Border Patrol encounters and job openings track closely.
Implicit in the following figures is the assumption that the number of encounters is a good proxy measure for the flow of illegal immigrants into the United States. Encounters are, of course, an imperfect measure. The same illegal immigrant could be encountered several times, returned, and then come again before finally evading Border Patrol and being released into the United States. “Gotaways,” border crossers who evade Border Patrol, are not counted as encounters and are only estimated and not included below. Encounters also doesn’t include visa overstays. Still, it’s reasonable to assume that encounters are a decent proxy measure for changes in the flow of illegal immigrants.
Figure 1 shows the relationship between monthly job openings and monthly SW Border Patrol encounters. There’s a strong relationship between the number of job openings and encounters, especially during the Trump and Biden administrations. Obama is in the bottom left, with mostly fewer job openings and few border encounters. Bush also has few job openings, but many more encounters. Biden is on the right with many more job openings and many more encounters. Trump is in between with more job openings than Bush or Obama, but with monthly encounters similar to Obama and trending up with the number of job openings that bleeds into Biden’s era of record job openings and border encounters.
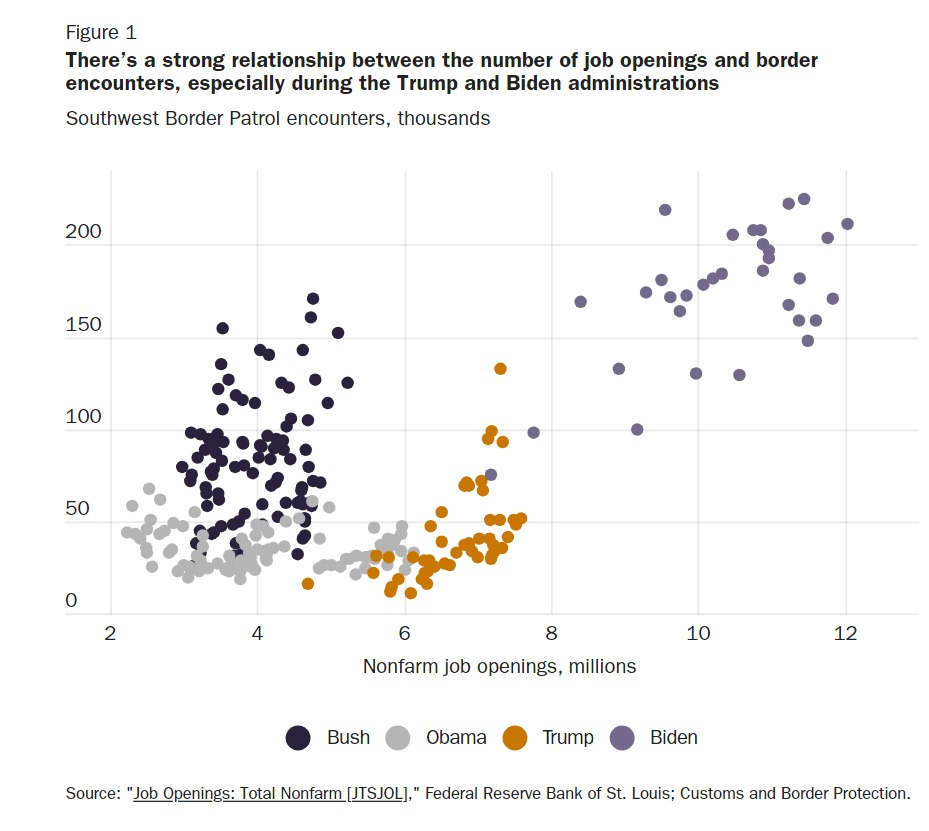
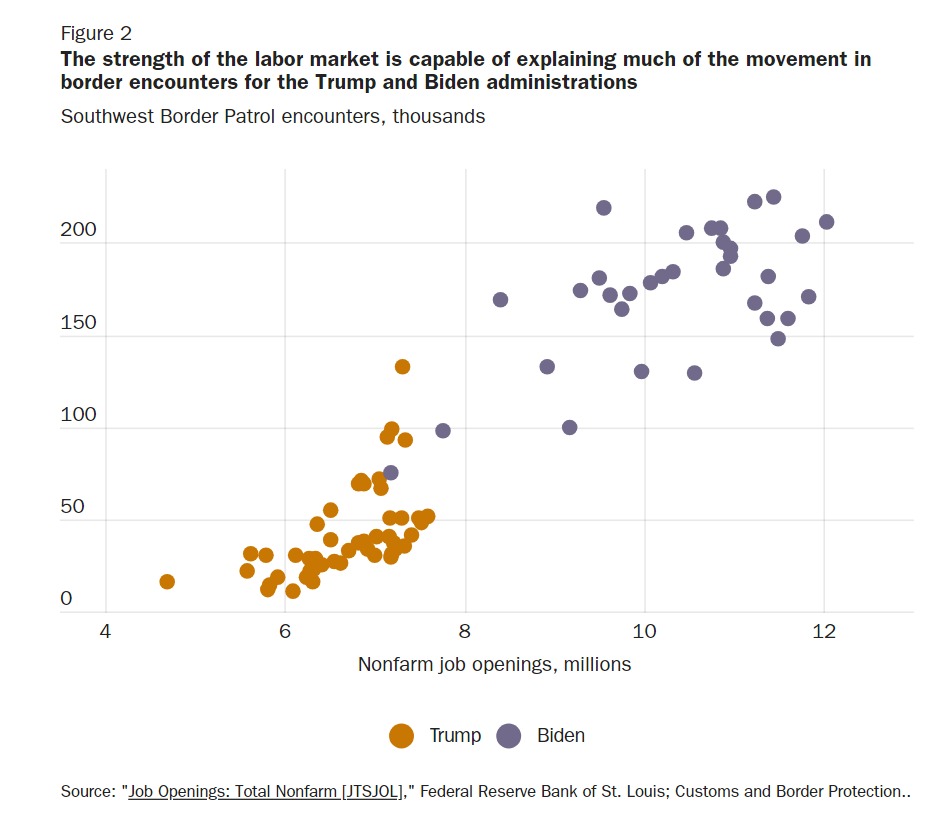
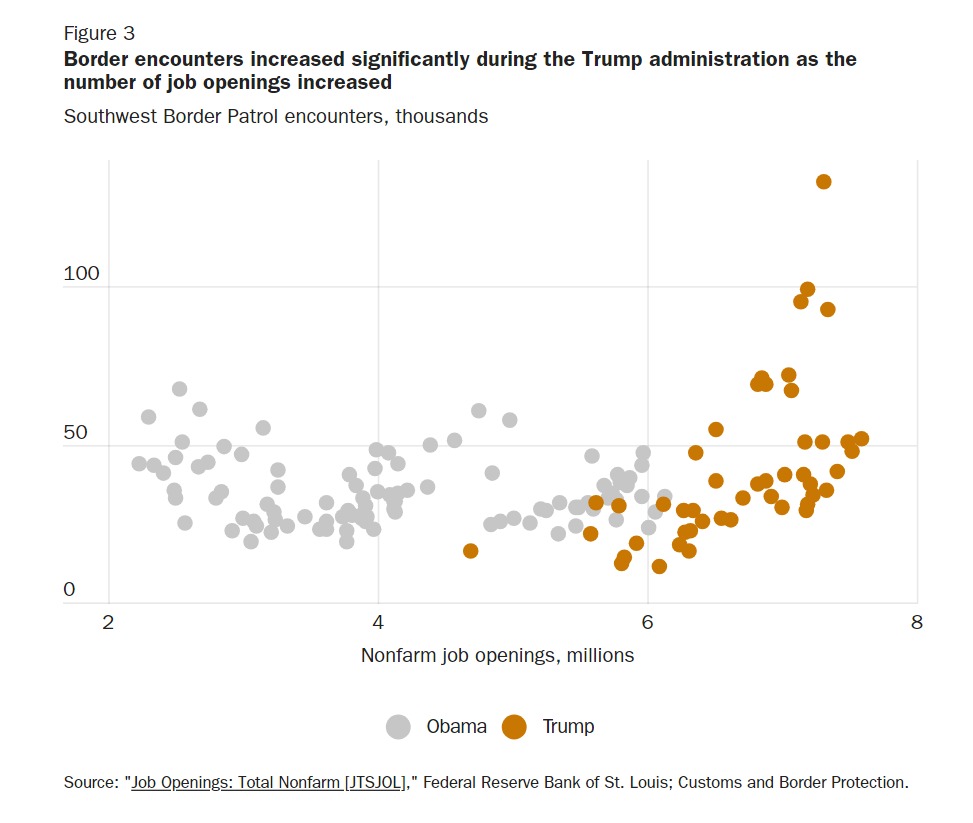
Figure 2 focuses on just the Trump and Biden administrations and it doesn’t look like Biden administration border policies boosted illegal immigration. The strength of the labor market, at least according to the job openings measure, seems capable of explaining much of the movement in border encounters. Perhaps most surprisingly, the trend of job openings and southwest Border Patrol encounters looks very similar for the Obama and Trump administrations (Figure 3). There’s much overlap between the two, but encounters rise significantly during the Trump administration as – you guessed it – the number of job openings increased.
Real wages are rising and labor force participation rates are up for native-born and foreign-born workers. But even if wages were stagnant, it would have a comparatively small effect on the supply of immigrant labor because their relative wage gains from immigrating here are already so large.
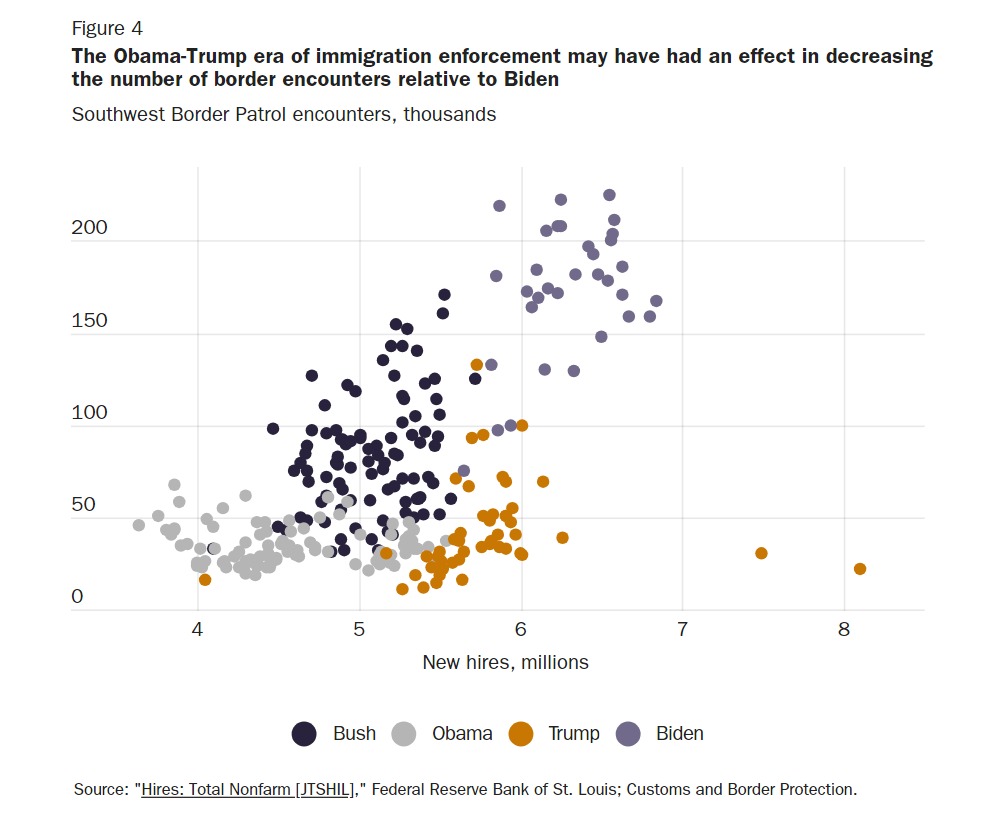
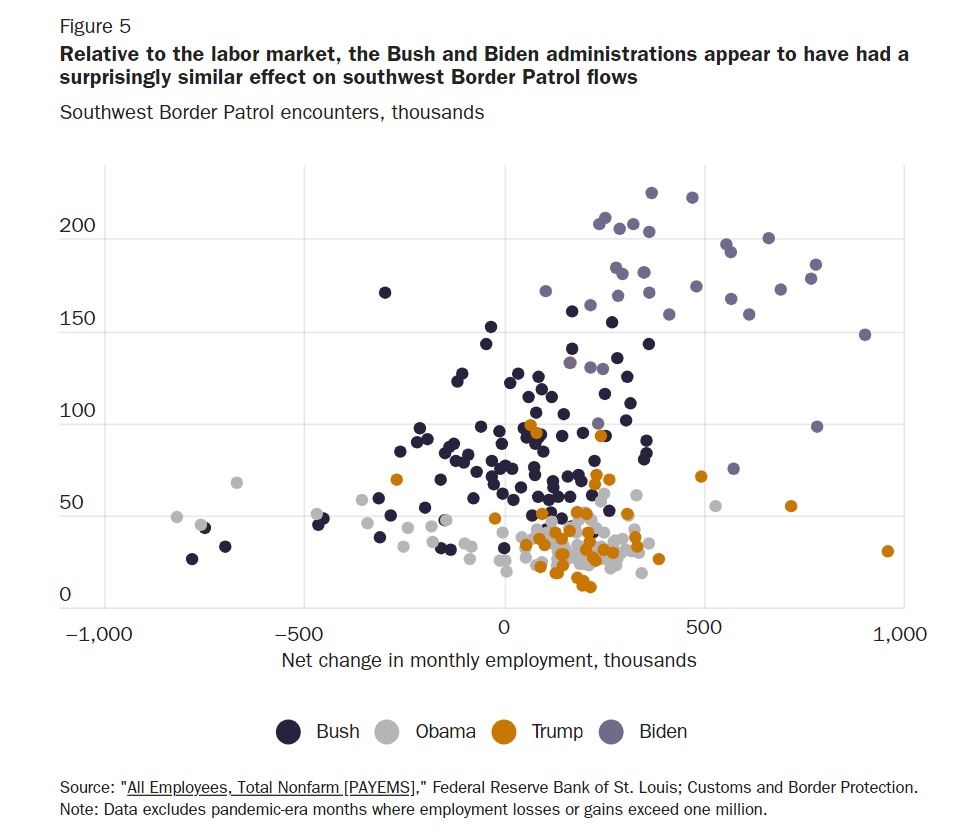
But the labor market can’t explain all cross-border movements. Conditions in sending countries, the cost of travel, and U.S. border enforcement also matter. Figure 4 uses new hires, a different measure of the strength of the labor market. Forget the two Trump data points on the right as those are during the height of the pandemic in May and June of 2020. It does look like the Obama-Trump era of immigration enforcement really could have had an effect in decreasing the number of border encounters relative to Biden. Figure 5 shows the monthly change in net employment and southwest Border Patrol encounters excluding months where employment losses or gains exceed one million (pandemic), which makes the Bush and Biden eras of border encounters look starkly different from the Obama and Trump era.
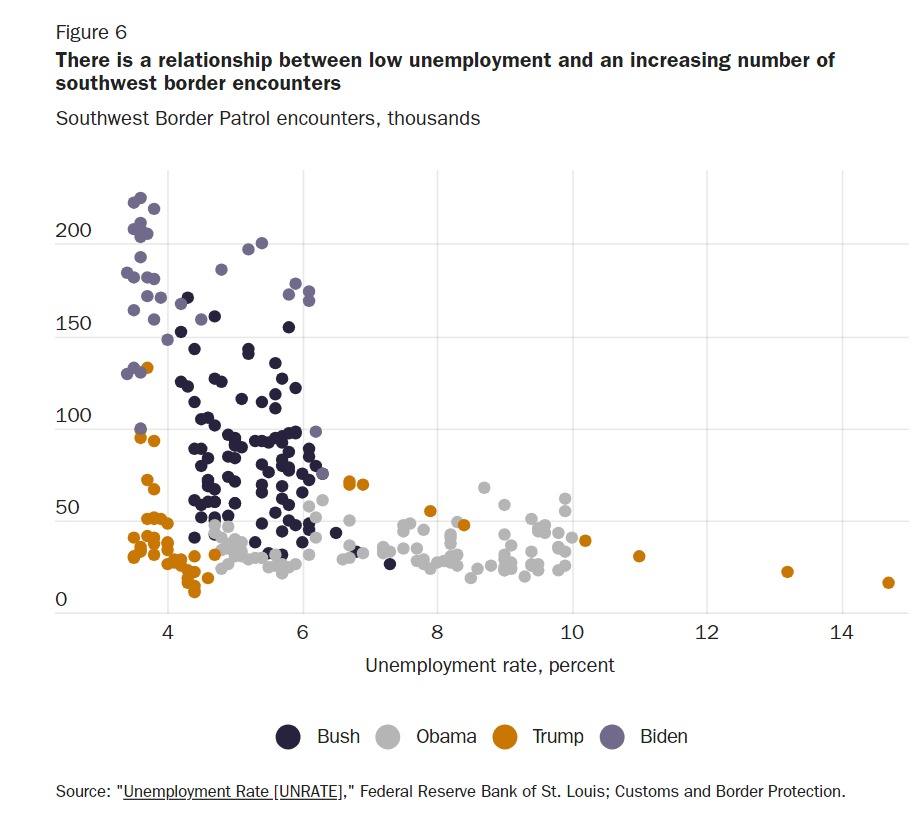
The next measure of the strength of U.S. labor markets is the unemployment rate, which has averaged 4.3 percent during the Biden administration compared to 5 percent during the Trump administration (higher due to the pandemic) and 7.4 percent during the Obama administration. Figure 6 still shows a relationship between encounters and low unemployment, but it is the best case for enforcement having a large impact on encounters. Monthly unemployment rates for the Trump and Biden administrations are both low, with 41 months at less than 4 percent split about evenly between the two administrations. When unemployment was below 4 percent during the Biden administration, the average number of monthly SW Border Patrol encounters was 180,000. During the Trump administration, the same number was 56,000 – 69 percent below Biden.
The macro fact most supportive of the theory that Biden’s border actions increased SW Border Patrol encounters is that the numbers increased substantially within a few months of him taking office, from 75,000 in January 2021 to 169,000 in March 2021, or 125 percent. But then the proponents of that theory must also explain why SW Border Patrol encounters increased by 365 percent in the last ten months of the Trump administration. Was that also due to changes he made in border enforcement policies? Possibly because Title 42 changed the incentives, but that would change another one of their arguments entirely because immigration enforcers thought Title 42 aided in enforcement.
The last measure of demand in the labor market in this post is the vacancy-unemployment ratio (V-U ratio). The higher the V-U ratio, the more job vacancies there are relative to the unemployment rate. Vacancy rates are similar to job openings (+0.99 correlation coefficient), but I still use the vacancy rate data here. This is another way to present the same insight as the Beveridge Curve. The V-U ratio during the Biden administration has averaged 6.3 percent, while it averaged 4.1 percent during the Trump administration. Plotted against SW Border Patrol encounters, the Biden administration really is an outlier with an exceptionally high V-U ratio that is attracting many more illegal immigrants and other border crossers (Figure 7).
The surprising conclusion from the above figures is that the enforcement policies of the Bush and Biden administrations look like they had a similar effect on southwest Border Patrol flows, relative to the labor market. Also, the Obama and Trump eras look about the same, controlling for the labor market. The unsurprising conclusion is that the strength or weakness of the U.S. labor market can explain much, and I’d wager most, of the flow of illegal immigrants across the SW border.
The economic gains from working in the United States mostly explain why immigrants want to come here in the first place and the dearth of visas is why so many come illegally. However, the state of the U.S. economy and labor market should be the first explanation that people consider when explaining changes in the flow of illegal immigrants. Policy matters, but the economy matters more.
