Voting Resources
Immigrant and Native Consumption of Means‐Tested Welfare and Entitlement Benefits in 2019
On the welfare program level, immigrants consume less welfare than native‐born Americans in all cases except for the cheapest program of the Special Supplemental Nutrition Program for Women, Infants, and Children.
Total government spending on the welfare state amounted to about $2.5 trillion in 2019. The federal government spent roughly $2.3 trillion in that year, an amount equal to approximately 51 percent of all federal outlays. About $1.7 trillion of federal expenditures went to Social Security and Medicare, and the other roughly $534 billion funded means‐tested welfare benefits. American states spent an additional $244 billion on means‐tested welfare programs in 2019. Based on data from the Survey of Income and Program Participation, we find that immigrants consume 28 percent less welfare and entitlement benefits than native‐born Americans on a per capita basis. By comparison, immigrants consumed 21 percent less welfare and entitlement benefits in 2016 on a per capita basis. From 2016 to 2019, the underconsumption of welfare by immigrants relative to native‐born Americans widened by about 7 percentage points.
Background
Immigrant consumption of welfare benefits has been a contentious policy issue for decades. This brief updates previous Cato policy briefs on immigrant welfare consumption in an attempt to supply better evidence to policymakers. The federal government spent slightly less than $2.3 trillion in 2019 on the welfare state, an amount equal to approximately 51 percent of all federal outlays in that year. About $1.7 trillion of those expenditures went to Social Security and Medicare, whose intended beneficiaries are the elderly, while the other roughly $534 billion went to means‐tested welfare benefits, whose intended beneficiaries are the poor. American states spent an additional $244 billion on means‐tested welfare benefits.
Means‐tested welfare programs are intended to aid the poor of any age. Eligibility for those programs and the value of their benefits are based on a variety of factors, including the recipient’s immigration status, income, and employment. For the purposes of this brief, means‐tested programs include Medicaid, the Supplemental Nutrition Assistance Program (SNAP), Supplemental Security Income (SSI), Temporary Assistance for Needy Families (TANF), and the Special Supplemental Nutrition Program for Women, Infants, and Children (WIC).
Entitlement programs are intended to aid the elderly, and age is the primary eligibility requirement for entitlements. The value of taxes paid into the program and the number of years worked by the recipient also affect eligibility and the value of benefits. For the purposes of this brief, Medicare and Social Security benefits are entitlement programs. Social Security benefits include self‐benefits and benefits on behalf of children. The Census Bureau’s 2020 Survey of Income and Program Participation (SIPP) doesn’t survey every welfare or entitlement program, but the programs that it does survey are responsible for more than 92 percent of American welfare state spending.
Methodology and Data Sources
This brief uses Wave 1 microdata from the SIPP. The SIPP is a household‐based survey constructed from a series of national panels that represent samples interviewed over a multiyear period, providing information on the relationship between household income, participation in government programs, and household demographic data. Wave 1 of the 2020 SIPP covers the usage rates and dollar values of means‐tested welfare and entitlement programs from January to December 2019. Population data come from the Current Population Survey (CPS). This brief uses nearly identical methodology and data sources as our previous brief, “Immigrant and Native Consumption of Means‐Tested Welfare and Entitlement Benefits in 2016.”
There are several steps to calculate the value of per capita welfare consumption for both immigrants and native‐born Americans. The first step involves using the appropriate survey questions in the SIPP to calculate the dollar amount spent per capita on welfare used by immigrants and native‐born Americans. To reduce bias in point estimates, we use the provided survey weights in this step. Second, we use the SIPP population data and the estimates from step one to calculate the total amount of welfare used by each program. Third, we calculate the weighted proportion of all welfare benefits used by immigrants and native‐born Americans by age group. Fourth, to adjust for underreporting of welfare consumption, we multiply the weighted proportion in step three by the actual budget outlays for welfare programs in 2019 according to the U.S. budget and state welfare spending on the same programs. Underreporting welfare consumption is a major problem in all surveys. In this brief, we also include state welfare expenditures on these programs to provide a fuller picture of the welfare state. As a result of our addition of state welfare expenditures, the dollar amounts in the tables and figures are not directly comparable with earlier Cato briefs on this topic for Medicaid, SSI, and TANF. Step four assumes that native‐born Americans and immigrants in each age group underreport welfare consumption at the same rate. The fifth and final step is to divide the product from step four by the real 2019 population of native‐born Americans and immigrants as reported by the CPS. The result is the per capita welfare cost for immigrants and native‐born Americans for each welfare and entitlement program.
There are several nuances in welfare program eligibility in the SIPP data set that must be understood to make sense of the results. Program eligibility and the value of benefits received are based on the unit of assistance, which is either the individual or the household. Individuals are the unit of assistance for Medicaid, SSI, Social Security benefits, and Medicare. The household is the unit of assistance for WIC, TANF, and SNAP. The SIPP data set does not allow us to divide the welfare benefits legally received by the members of a household for programs with a household unit of assistance. We therefore divide the benefits from WIC, TANF, and SNAP equally across all members of the household.
Other studies evaluating immigrant welfare participation and consumption use the household as the unit of analysis for all programs. We dispute this approach, as many spouses and children of immigrants are native‐born Americans. Counting native‐born welfare consumption as immigrant consumption improperly inflates estimates of immigrant welfare use and deflates native‐born consumption. Moreover, this approach reduces usage rates and benefit levels for means‐tested welfare and entitlement programs that have an individual unit of assistance. A rule by the Trump administration’s Department of Homeland Security firmly sides with our preferred measure of using an individual unit of assistance rather than the flawed household approach.
Because the SIPP does not record the dollar amount of Medicaid and Medicare benefits expended per user, we rely on the total expenditure numbers from the Centers for Medicare and Medicaid Services to calculate the per‐user expenditure rate. We first identify individuals who reported Medicare and/or Medicaid coverage in 2019 in the SIPP data. From these, we then identify the individuals who reported consuming health care services that account for most health care expenditures: hospital stays, prescription medication use, and physician visits. We assign these individuals the reported per‐enrollee expenditure amount for 2019.
Results
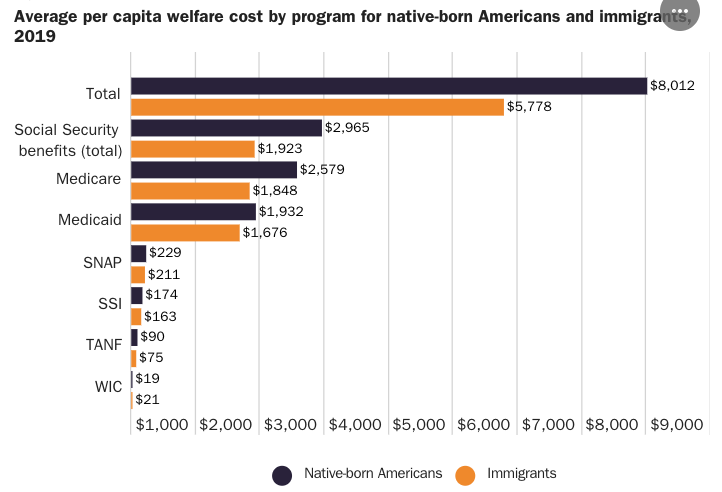
Figure 1 shows the average per capita welfare costs by program for all native‐born Americans and all immigrants. The average value of welfare benefits per immigrant was $5,778 in 2019, about 28 percent less than the $8,012 average value of welfare benefits per native‐born American. The average native‐born American consumed more than the average immigrant for all welfare programs covered by the SIPP other than WIC, where immigrants consumed $2 more on average than natives. In all calculations, tables, and figures, TANF includes state maintenance of effort expenditures, which are funds that state governments are required to spend on benefits and services for needy families each year to qualify for federal TANF funding. SSI expenditures also include federally administered state supplementation. Because SIPP data do not distinguish between use of federal and state funds, these inclusions produce more‐accurate estimates.
On the welfare program level, immigrants consume less welfare than native‐born Americans in all cases except for the cheapest program of WIC. In 2019, immigrants consumed 13.3 percent less Medicaid than native‐born Americans on a per capita basis compared with 2016, when immigrants consumed 10.8 percent more than native‐born Americans. For SSI, immigrants consumed 21.4 percent more than native‐born Americans in 2016. In 2019, immigrants consumed 6.3 percent less SSI than native‐born Americans. WIC is the only program where immigrants now consume more than native‐born Americans in 2019 compared with 2016.
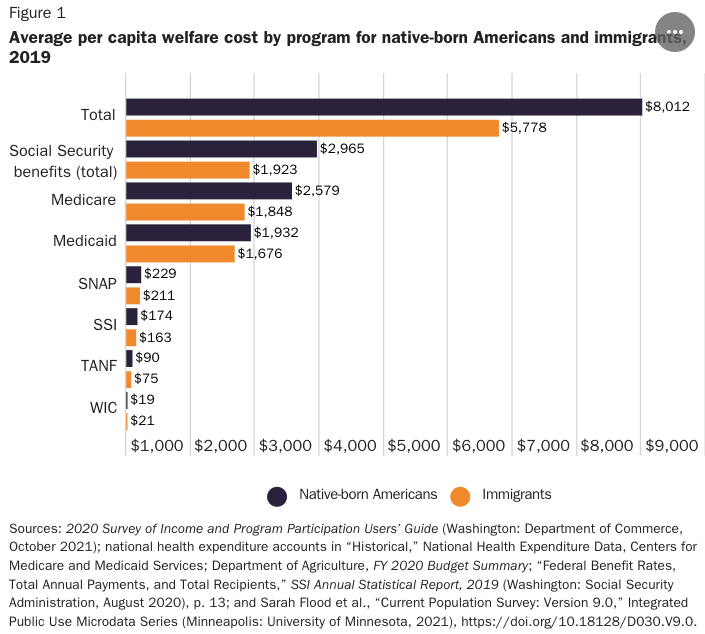
Per capita welfare costs vary considerably by age and program. Figure 2 shows the per capita welfare cost for native‐born American and immigrant children aged 0–17. Welfare costs for immigrant children are 43 percent lower than welfare costs for native‐born American children. Figure 2 evaluates fewer welfare programs than Figure 1 because children in the 0–17 age bracket do not fulfill eligibility requirements for some means‐based welfare programs.
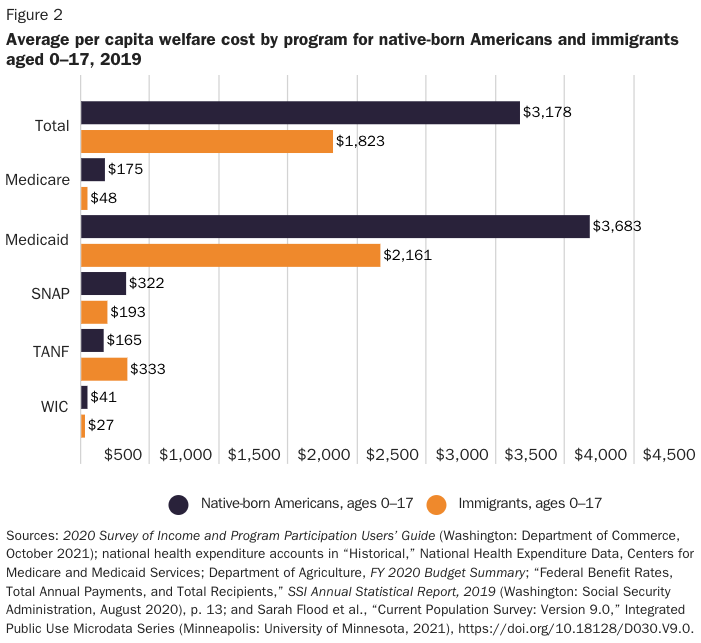
Figure 3 shows the per capita welfare cost for working‐age immigrants and native‐born Americans aged 18–64. The value of welfare benefits consumed by working‐age immigrants is about 37 percent less than the value of benefits consumed by working‐age native‐born Americans. WIC and Medicaid are the only programs where the average value of welfare benefits consumed per immigrant is higher than the average value of welfare benefits consumed per native, probably because more immigrants are legally eligible to receive those programs.
Figure 4 displays the per capita welfare cost for native‐born Americans and immigrants aged 65 or older. Elderly immigrants consume, on average, about 19 percent less welfare benefits than native‐born Americans. For Social Security benefits and Medicare, the two largest programs, elderly immigrants consume less than elderly natives; for smaller programs and Medicaid, the opposite is true. When compared with Figures 2 and 3, Figure 4 shows that the per capita average cost for Medicaid, SSI, SNAP, and Social Security benefits for elderly immigrants is higher than the per capita average cost for younger immigrants. Per capita Medicare costs are also higher for the elderly but are lower for immigrants than for native‐born Americans. This difference is probably the result of elderly immigrants having less access to the more expensive entitlement programs, such as Medicare and Social Security benefits.
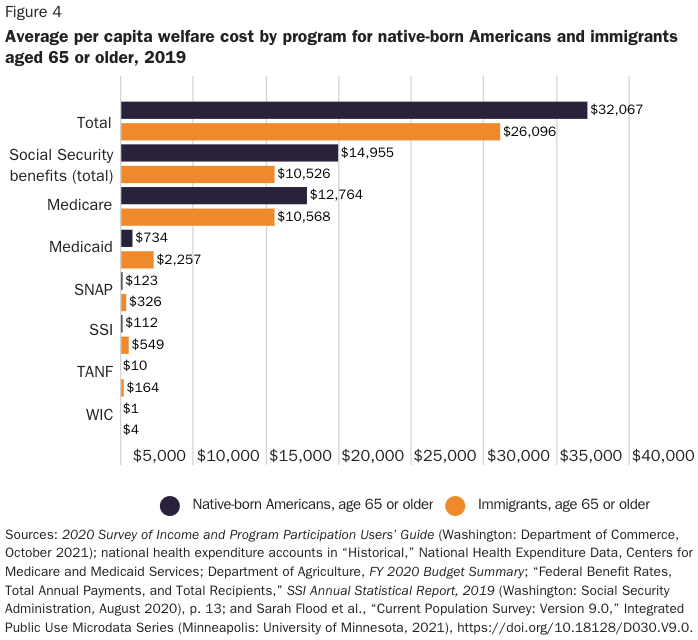
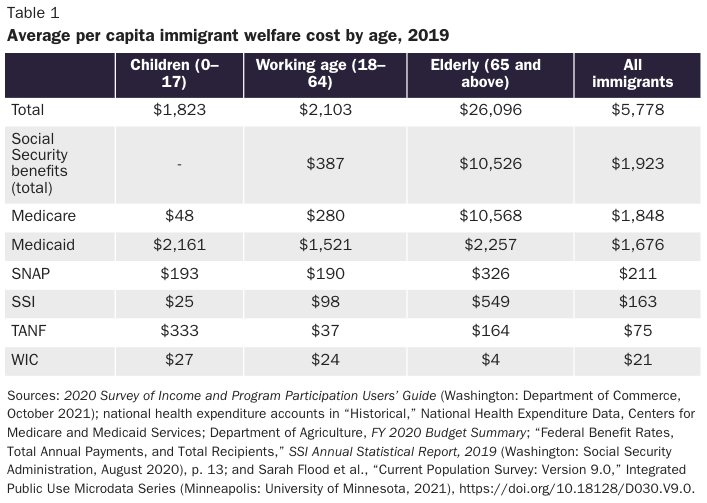
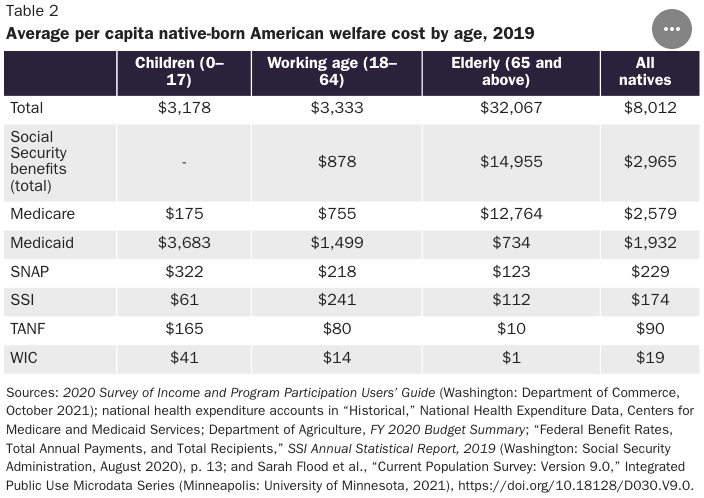
Table 1 shows the average per capita immigrant welfare cost by program and age. Immigrant age significantly alters per capita welfare cost. Individual elderly immigrants aged 65 or older consume about 12.4 times more welfare benefits than immigrants aged 18–64 and about 14.3 times more welfare benefits than immigrant children aged 0–17. Reducing the welfare consumption of elderly immigrants aged 65 or older will yield the largest per capita fiscal benefits. Table 2 shows the same numbers for native‐born Americans by age, where a similar pattern emerges.
Welfare Usage Rates
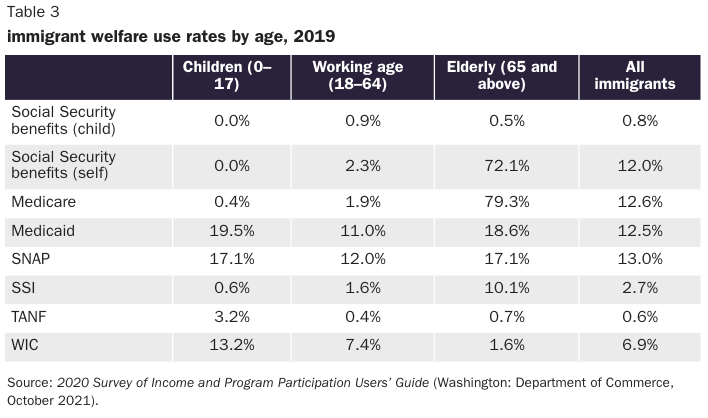
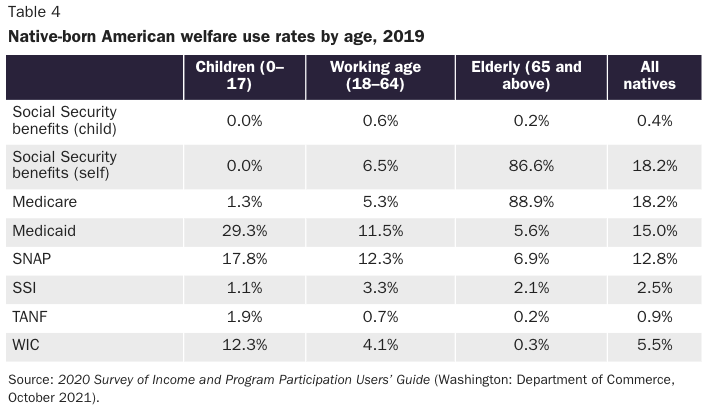
The figures and tables above present the weighted average value of welfare benefits consumed per capita. Tables 3 and 4 show the usage rates for each age group of native‐born Americans and immigrants for each welfare program. We consider a person to have used the welfare program if that person consumed the welfare benefit at any point during the 2019 calendar year. Medicare and Medicaid usage rates only include individuals who were covered by the programs and consumed their services through hospital stays, prescription drugs, or physician visits. This differs from our previous brief, in which usage rates included all covered individuals. We believe this change improves our analysis, since welfare consumption, not coverage, is the primary subject of this brief. The Social Security benefits in Tables 3 and 4 are divided between those received on behalf of children and those received on behalf of oneself.
Discussion
Overall, immigrants consume about 28 percent fewer welfare and entitlement benefits than native‐born Americans. Working‐age and elderly immigrants tend to consume more Medicaid benefits than native‐born Americans in the same age groups, but for all other large programs and many minor ones, natives are more expensive than immigrants on a per capita basis. This exception is possibly due to a substitution effect: fewer immigrants qualify for the more expensive entitlement programs such as Medicare and more have legal access to Medicaid. For instance, states have the option of providing Medicaid to pregnant lawful permanent residents, immigrant children, and illegal immigrants in emergency situations and other rare cases. Refugees and asylum seekers also have access to means‐tested welfare benefits for their first seven years in the United States. Minor legal changes can significantly reduce immigrants’ access to all these programs.
Our findings here are similar to earlier Cato research that used the CPS instead of the SIPP data to measure welfare use and to Cato research that used nearly identical methodologies with older SIPP data. In fact, the gap between immigrant and native welfare use has widened by 7 percentage points since our last evaluation. Evaluating individual welfare usage—the correct methodology, according to the Department of Homeland Security and most other researchers in the field—is superior to the flawed household approach and yields directionally similar results regardless of whether the CPS or SIPP is used. In other words, other evaluations of immigrant welfare usage based on the household methodology found that immigrants use more welfare because they counted the welfare usage of nonimmigrants in the household.
Conclusion
Native‐born Americans consume, on an average per capita basis, more welfare and entitlement benefits than immigrants. The dollar differences are most pronounced for the large entitlement programs of Medicare and Social Security benefits, the two largest programs in the American welfare state. The largest percentage difference in per capita welfare consumption is between immigrant children and native‐born American children. Although elderly and working‐age immigrants, on a per capita basis, consume more Medicaid than native‐born Americans in the same age groups, and although immigrants occasionally consume more of the smaller welfare programs in certain age groups, those are the exceptions.